|
Data Overview
SAS datasets are accessible though the BI Flash iPhone application. SAS
datasets are stored in libraries on the server similar to how
files are stored in folders. Each library is associated with a different
folder on the server which contains one or more datasets. You
then have the option of selecting the library which contains datasets
you wish to view. The screen that lists the available
datasets can be accessed
through the "Dataset" navigational button at the bottom
of your screen.
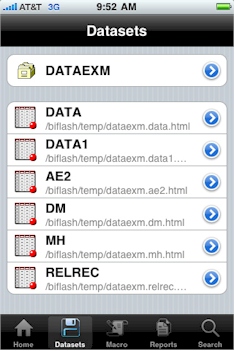
This will list all the available SAS dataset from the specified
library. You can then view the contents of the data by
selecting on dataset from the list. This is accomplished by
tapping anywhere on the row of the displayed dataset name.
Selecting Data
The main dataset screen displays all datasets that you have
access to in the specified library. The list displays a
short dataset name followed by the more
descriptive dataset label below each dataset. You can select
a different library by selecting the library name at the top of
the dataset view to display the library selection screen as shown
here:
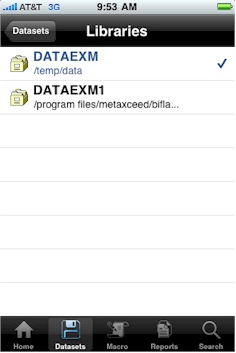
Once you select the library, you can then return back to the
main Dataset screen by selecting the "Datasets"
navigation button at the top. From the list of datasets on the dataset screen, you can view
the data by selecting anywhere on the entire row of the dataset
name and label. This will then navigate you to the dataset
view screen which displays the detail values of the dataset.
The libraries and user
access to the libraries are similar to how SAS libraries are
created with LIBNAME but managed in the library
management tools by an administrator.
Viewing Data
SAS datasets can be very large. BI Flash will break down
the data into viewable screens of 20 rows at a time. Upon
the selection of the dataset from the main dataset screen, you
will be brought to the data viewer.
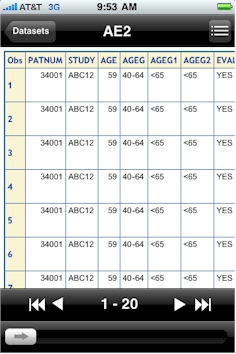
You can navigate to specific observation of the data by
selecting the navigational next and back arrow buttons at the bottom of
the viewer. The slider also allows you to quickly jump to a
specific segment of the data quickly. You can also tap on the current observation
number (1-20) to then be presented with a list of the data chunks.
This allows you to navigate across larger sets of data.
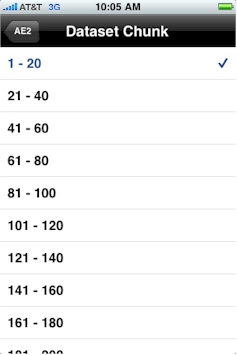
The list of "chunks" of data can be scrolled through
by swiping vertically. This will allow you to scroll through
the entire observation list and select on the specific chink of
data to be viewed. Upon selection, it will display data
viewer with the data with selected observations.
You can also configure how the variables are to be
displayed. These options are available through the button
shown here:
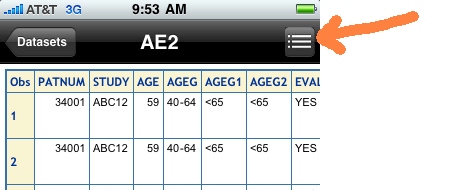
This button is a toggle which flips the screen between the data
viewer and the configuration screen shown below:
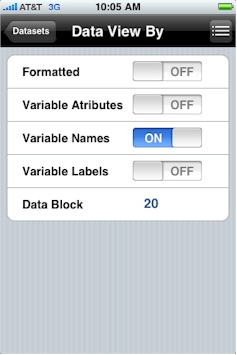
The options include the following.
- Formatted - This will apply any SAS formats or user
defined format with the associated format catalog upon the
view of the data.
- Variable Attributes - This will display the variable
label, length and related attributes similar to what you would
see in a PROC CONTENTS.
- Variable Names - The column header will display the
variable name as part of the title.
- Variable Label - The column header will display the
variable label as part of the title.
- Data Block - Defines the chunk size of the data which
will be viewed to optimize viewing experience for large
datasets.
|