The data object is a collection of
information managed by the Trialex System designed for organizing SAS datasets within a clinical data
warehouse. The data object does not store the contents of the SAS dataset but,
instead, it captures meta data pertaining to SAS datasets within a clinical study.
This information becomes very useful for study management and documentation. Some of
the information gathered for the data object includes:
Dataset name
Description
Date and time of last modification
Created date and time
Order of data
Data source path locations
Status of data
This information is stored as a
SAS dataset named Data. This dataset is stored in the study directory and
is managed by the Trialex System. This dataset may be viewed, but it is recommended
that it is not altered outside of the Trialex System. The purposes for centrally
managing the meta data of SAS datasets includes:
Proper refresh or execution of the
data warehouse
Documentation
The data object can be found in
the Trialex System study conduct area.
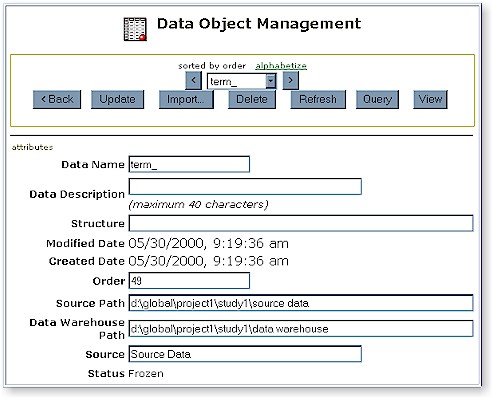
The data object enables quick
review of attributes pertaining to any dataset within a specific clinical study.
This meta data optimizes the management of the clinical study. The main object
browser screen is shown here:
The view shown is sorted by the
order number. This implies that if the next button were selected, the data object will navigate to the view of the next
dataset ordered by the order attribute. In addition to the order attribute, the list
of datasets can also be sorted alphabetically. This is available by clicking on the
alphabetize hyperlink.
In addition to the meta data,
there is an option to view the actual contents of the data. In this case, the View
button will display a view of the SAS datasets in twenty observations per screen.
The Data Viewertool will allow for quick view of the data and associated
variables.
The eData tool is a SAS viewer
designed to optimize viewing SAS datasets through a web browser. It has similar
features to the SAS
System Data Viewer which includes:
View formatted and unformatted
values from SAS datasets
View SAS variables and their
attributes
Search and subset dataset
View data by sorted variables
View Frequency Summary
Export view to Excel
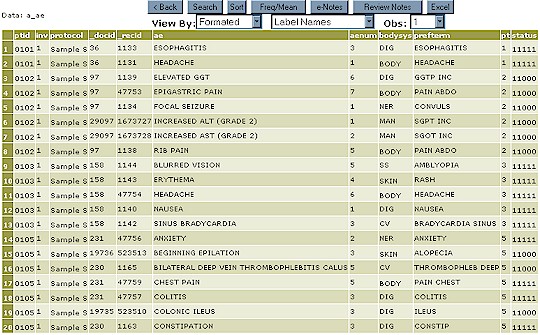
The main Data Viewer view
is shown here:
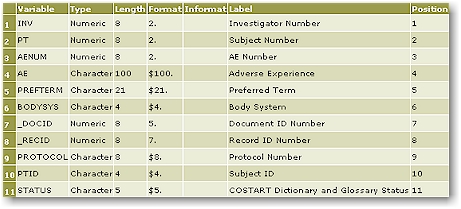
The default view displays the
values as unformatted variables. It is optional to switch the view to formatted
values by selecting the View By pull down menu. The last item on this same
menu gives the option to view all the SAS variables and their attributes. An example
view of the adverse event dataset is shown here.
There are two methods for
navigating to different observations within the dataset. The first method is to
click on the hyperlink
which appears at the bottom left of the view. This will go to the next 20
observations from the current view. The second method is to select from the pull
down menu named obs which allows for quick navigation to a specific observation
further in the dataset.
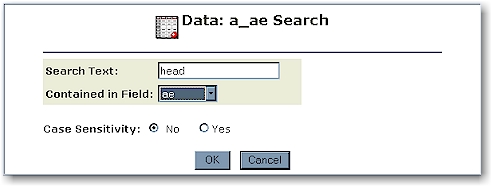
Searching the dataset is a useful
way of getting to exact values within the dataset. The search button will display
the following dialog box.
In this example, the selected
search will find any occurrence of the text "head" which is contained in the
variable ae. It is optional to have this search be case sensitive.
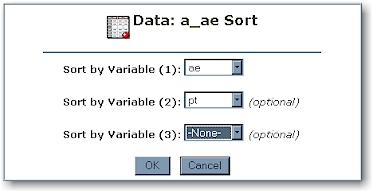
Data Viewerenables the
sorted views. The view can be sorted by up to three variables. This is
accomplished through the Sort button as shown here.
The sort and the search criteria
can be compounded into one view.
Data Viewerhas been
optimized to show only data twenty observations at a time so that it can be more optimally
delivered over a web browser.
Besides viewing the values and the
variable attributes of the selected data, it is also possible to get a frequency summary
or a mean summary of a selected variable. This is accomplish through the Freq/Mean
button. The selection lists all the variables from the dataset with categorical
variables highlighted in green and continuous variables in blue. Categorical
variables are either character variable or numeric variables with user defined formats.
Continuous variables are numeric variables without a user defined format.
KEY: Green - Categorical Variables Blue - Continuous Variables
A mouse click on the selected
categorical variable will drill down to a frequency summary of that specific variable.
The following example summaries the body system variable.
A selection of a continuous blue
variable will result in a mean summary such as the one below:
Data:
a_ae
Variable:
AENUM
Mean
Minimum
Maximum
Count
Standard
Deviation
Standard
Error of Mean
3.162
1
12
2408
1.771
0.036
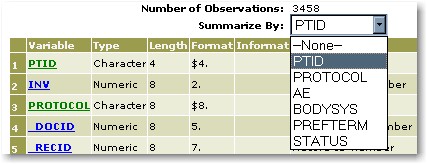
It is optional to
have the summary be applied by the values of a specified variable. The
"by" variable can be selected from the variable screen as shown here.
The list of summarize by variables
are only categorical variables. Once a summarized by variable has been selected, you
can drill down to the frequency or mean statistics in the same way by clicking on the
variable of interested. Note that you can not drill down to the statistics of the
same selected summarized by variable.
In this example, the body system
variable system is selected with the patient id as the by variable.
Data:
a_ae
Variable:
BODYSYS
By Variable (PTID):
Value
Frequency
Percent
1
BODY
3
23.1
2
CV
1
7.7
3
DIG
3
23.1
4
HAL
1
7.7
5
MAN
2
15.4
6
SKIN
3
23.1
The default value
of the by variable will be the first value that appears in the data set. The
pull-down menu of each patient allows for the navigation to other statistics for the body
system variable. This same methodology of the using the summarized by variables can
also be applied for continuous variables.
Similar to the data view,
frequency and mean summary views can be incorporated into an e-note. In that case,
the summary will be attached to the email associated with the e-note. This enables
more effective discussions pertaining to the frequency counts and mean summary statistics.
Export View to Excel
The current data view can be
exported to Excel format through the Excel button. Search and sort
conditions placed upon the data will be applied before the creation of the excel export
file. This is useful if you were to narrow your view to the proper data points and
then you can use the excel spreadsheet for further investigation. The excel
spreadsheet will be delivered via email.
The Trialex System has tools which
automate the capturing and updating of metadata pertaining to SAS datasets. The
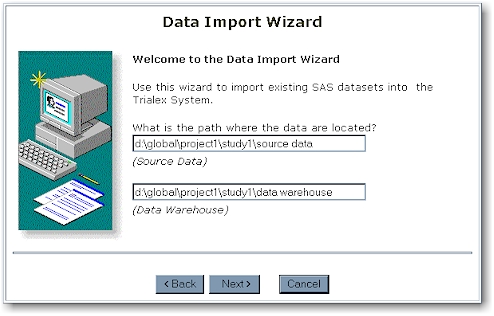
first of these tools is the import wizard. This is accessible through the button.
This wizard will import meta data from datasets available to the current clinical
study and store this information within the Trialex System. The first dialog box of the
import wizard asks for the location of the data.
Click on the next button to
proceed with selecting the specific datasets.
There is an option to select
multiple datasets. If the data already exists in the Trialex System, the attributes
will be updated accordingly. Click on the next button and it will proceed with the import.
A status of all the datasets imported will be shown.
In the event that the data are no
longer part of the study, the delete button can be used to delete the current data object
that is being viewed. Note that the _template_ is permanent and cannot be deleted.
The refresh button will update all
the data which has already been imported. This is designed for datasets which have
been imported but perhaps have been changed since the last import. Unlike the
import feature, however, the refresh will apply updates to all existing datasets so no
additional selections are necessary.