Automating the Management of a Data Warehouse Sy Truong, Meta-Xceed, Inc., Fremont, CA Kathy Boussina, Genentech, Inc., South San Francisco, CA Overview Clinical trial reports and clinical data warehousing have traditionally been two different streams that merge at the final reporting stage. The function of generating the final clinical trial report and the delivery of a clinical data warehouse is often carried out by different departments. The transfer of information is frequently paper-driven and less than seamless. As the FDA guidelines evolve to meet the upcoming goals for paperless submissions and as the technology emerges, it becomes increasingly critical to improve areas of streamlining and automation. Genentech recently launched the electronic reporting pilot project to streamline the process to meet the FDA electronic reporting requirements. The goal of this project was to link clinical trial reports to SAS output and to data, thereby integrating publishing into the workflow. Hence, the need to publish SAS output and data is no longer occurring at the end of the process. To integrate output, data and documents from the outset and throughout the report development process, an application, known as e-DOC, was created for the pilot project. e-DOC facilitates broad and early access to information. It automates the management of the data warehouse by identifying dependencies; graphically representing the relationship of the SAS output to the data warehouse and the data warehouse to source data. It also provides for the ability to view detailed metadata (information about the data). The information is encapsulated and provided in a hyperlinked table of contents that fits neatly into the final clinical trial report. Electronic Submission Several components to a final clinical trial report constitute the complete deliverable. These include: the report text, the in-text tables, the report appendices (SAS output such as summary tables, by-patient listings and graphs), and patient profiles (case report tabulations). The objective of the Genentech, Inc. electronic reporting pilot project was to integrate the SAS report production activities into the document production activities. The goal was to develop a single process and workflow which addresses a final clinical trial report as a standalone deliverable or as part of a complete product licensing application or new drug application. The same procedures, documentation and overall workflow would be applicable for a single report or a complete FDA submission. The pilot project was conducted on an NT server using Office 97 in order to take advantage of Word 97 hyperlinking capabilities. Early in the project it became essential to track data from its source to SAS program(s) (transformation or summarization and reporting programs) and from there, to the SAS output. This is not only important information for SAS programmers on a project but also valuable documentation to internal (Genentech) or external (FDA) reviewers. The datasets as a component of a final report placed further emphasis on the need to provide documentation of the metadata and the relationship of analyses to datasets. Hyperlinked footers on summary tables and listings provided for SAS output to dataset or metadata access, while a supplemental document graphically depicted the dataset and the tables or listings produced from the dataset. This allowed for two opposing views of the same information. Both perspectives were adopted due to the broad audience for a clinical trial report including clinicians, statisticians, and FDA reviewers. The adoption of e-DOC to determine the dependencies and relationships defined by hyperlinks allowed varying views to be used within the application. Furthermore, in defining these relationships, we were able to take the integration of data and documents one step further by providing programmatically generated hyperlinks from one report component to the next. The e-DOC application was successful in facilitating the integration of the electronic report components for this pilot project. What is e-DOC e-DOC is a cross platform tool used to document data warehouses created from SAS. e-DOC’s primary function is to produce documentation illustrating the data flow of the data warehouse. In addition, this documentation can also be used to manage many of the warehouse components. Since the documentation is produced in HTML with easy navigation, the audience could range from technical users such as programmers and warehouse administrators to less technical customers who review information from the data warehouse. This tool, developed using SAS, is designed to analyze data warehouses created from SAS programs. It was tested for SAS 6.12 on Windows NT/95 and Solaris UNIX.
e-DOC consists of tools to aid the documentation process of the data warehouse. These tools are used during and after the development of a project to capture the most up to date information. It is intended to be integrated into the workflow so it would not hinder the development cycle of building a data warehouse. The main e-DOC tools are:
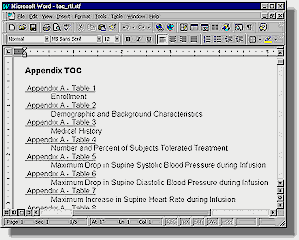
mk_html Component The mk_html tool, short for "make html," captures SAS output reports and converts them into HTML format. This can be executed during the report run time or after all reports are generated. Since the reports generated from SAS are mostly stored as ASCII text files, there is minimum conversion required between the original report and the final HTML version. All text is kept unchanged with the formatted HTML markup tag (<pre>) so that the text columns align properly. One feature of mk_html which is specific to Genentech, Inc. reports is the formatting of its source line. Source line is one line of text that appears at the bottom of all reports stating the program name and related data sources. An example source line is: Source: Biostatistics(truong) pgm(\\NT_SAS\cardio\drug\drugxyz\final\biostat\t_lab2) The mk_html tool automatically adds hyperlinks to the location of the SAS program and data. This results in an HTML page which is useful for further investigation of the data and programs involved in producing the report. e-TOC Component e-TOC is used to create a table of contents for all reports generated from the specified data warehouse. As a standalone tool, e-TOC produces an RTF file with hyperlinks as shown:
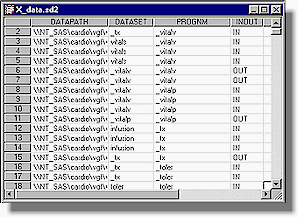
e-TOC uses Genentech's standard reporting structure to capture titles and descriptions of these reports programmatically. This frees users from having to re-type this information and therefore reduces potential typographical errors. Logeval Component Logeval is the brain of e-DOC since it determines the data flow relationships between one program to the next. It does this by logically parsing the log files produced from the SAS programs that comprise the data warehouse. Approaches other then logeval were explored, but these approaches had limitations and were problematic. One approach was to capture the SAS environment at the start of a SAS session. This included all the libnames and all datasets within these libnames. The dataset created date and modified date were also recorded. Once the SAS session was completed, a similar environment capture algorithm was executed and stored. The idea was that a comparison between the before and after capture would document changes made in this particular SAS program. The problem with this approach was that if another SAS process were running at the same time, the data changes within the same libname would also appear in the capture. This overlapping session proved to be problematic and was the main reason why this approach was not pursued. Another approach was to have users follow a strict documentation practice within each SAS program. This suggested that all programs have a strict format with all the information documented in the header of each SAS program as comments. The SAS comments are compiled into one location for documentation. This approach proved to also be problematic since some programs did not have the header comments updated. This lead to discrepancies since data transformation logic within each program did not always reflect the comments. At first, the notion of parsing log files in a systematic algorithm to capture information for documentation seemed a daunting task. This reverse engineering approach for the logeval algorithm was only entertained as a last resort after exploring the alternatives. There were many cases within the log files which did prove to be time consuming but there were also messages in SAS log files which were logical and suitable for this approach. During log file evaluation, logeval’s first task is to differentiate between SAS comments and real submitted SAS code. There are two distinct styles of comment notation. One uses a (/*) to start and (*/) to end while another just uses asterisks with a semicolon to end. A SCL program is used in this parsing since it is efficient and has many essential text manipulation functions. An example of logic to evaluate the beginning of the first style of comments is: *** Check for comment style (1) ***; if (index(line,"/*") > 0) or (index(line,"*/") > 0) then do; *** note global comment status ***; com_on = 1; A similar index function is used to check for the start and stop of the second kind of SAS comments. There are many other checks logeval performs, but it is not possible to fully explain them all in this paper. However, a few algorithms are shown below to give you a flavor of this challenging task. Before data can be analyzed, libnames must be captured. An example code segment for handling this is: *** Analyze libnames ***; if index(line3,"NOTE: Libref") > 0 and index(line3,"was successfully assigned as follows:") > 0 then do; *** Check for line breaks ***; if index(libline," Physical Name: ") = 0 then do; Fortunately, the SAS log does contain some consistent references to libnames which have been assigned. A physical path is also captured which is used to verify its existence. This is important if the data warehouse is in a constant state of change. A similar approach is used to capture newly created datasets. The code segment example for this is: *** Capture output data sets ***; if index(line3,"NOTE: The data set") > 0 and index(line3,"has") > 0 and index(line3,"variables.") and index(line3," WORK.") = 0 then do; In most situations, the same algorithm applied to a SAS log executed on a UNIX server would also work on Windows PC. There are situations however which differ. A system macro variable is used to capture what Operating System (OS) is currently in use. This allows logeval to adjust accordingly on OS specific information as shown here: if (cur_os = "WIN_95") or (cur_os = "WIN_NTSV") then do; *** Look for page breaks ***; ... if cur_os = "Solaris" then do; *** Look for page breaks ***; All the information gathered during the evaluation of the log file is stored in a SAS dataset. This information is later used to determine how datasets are read into programs and how they are created. A partial view of a dataset would look like this:
The INOUT status of each dataset is recorded in relation to each program that comes in contact with the dataset. This information is later used to document the data flow between datasets and programs. e-map Component A picture is worth a thousand words. This is especially true when documenting the flow of data for a complex data warehouse. e-map automatically generates a graphical chart that illustrates how data moves through the warehouse. HTML was a natural format for e-map since it has these advantages:
The first task for e-map is to evaluate the dataset which logeval creates and then to organize that information in a manner used to generate the graphical diagram. For efficiency, the dataset values are strategically placed into SCL lists as shown in the following code segment. *** Capture program names into list ***;
dsid = open('work.x_data','i');
i = 1;
do while (fetchobs(dsid,i)=0);
prognm = getvarc(dsid,varnum(dsid,
'prognm'));
rc = insertc(proutlst,prognm,i);
i = i + 1;
end;
rc = close(dsid);
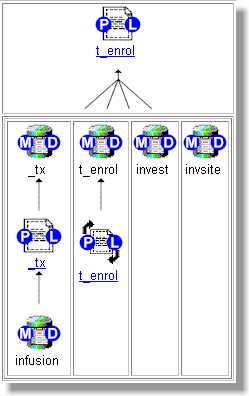
After all the programs are captured into a list, e-map draws a diagram for each program and its relationship to datasets. This relationship could be the creation of datasets or the reading of datasets as input. Each object in this diagram is represented by a GIF image as shown here:
The program object has hyperlink buttons marked with letters (P) and (L). If you were to click on this area, (P) would link to the program source code and (L) would link to the log. In a similar manner, the data object has hyperlinks marked with letters (M) and (D). The (M) links to the metadata, similar to what is found in a PROC CONTENTS. The (D) links to the actual values of the dataset. On the PC version, this would open the SAS Viewer tool and display values of variables inside each dataset. The arrows are used to connect the object to show how the data flows.
e-map generates the HTML code which points to the proper GIF images. In the example of the arrows, the image could show four joining arrows (as shown above) or it could be two joining arrows. An index variable in the program keeps track of how many arrows as shown in this algorithm: <img src="&webhost/jarrow&index.gif" > In this case, the webhost resolves to the location where the image is stored on the web server while the index resolves to a number which corresponds to the proper joining arrow image.
e-map generates the HTML in modules. Each program object gets generated with the associated data and arrows individually. This HTML module is stored in an HTML table cell. The final data flow diagram joins these tables cells in the proper position to form the whole picture. The HTML table cells’ border thickness is set to zero so that, when viewed, there are no lines separating each object. To clearly demonstrate how the cells are assembled, the cell thickness in the following diagram has been set to one:
As shown in this diagram segment, the recursive capabilities of nesting tables within tables makes it possible to assemble these individual table cells onto itself. The HTML tables also resize themselves when the browser is stretched. The flow diagram is visually descriptive especially when borders of the table cells are invisible. Each GIF image contains an image map. This allows users to click on parts of the image while linking to the proper drill down. The image maps are also dynamically created inside the SCL program through a submit block. The variables are resolved during execution as shown with a preceding ampersand (&) in the following example: submit;
<!-- &curprog -->
<div align="center"><center>
<table>
<tr>
<td align="center">
<MAP NAME="cr_&curprog">
<AREA SHAPE="RECT"
COORDS="28, 11, 45, 28"
href="l_&curprog.html"
target="_blank">
<AREA SHAPE="RECT"
COORDS="0, 12, 16, 28"
href="c_&curprog.html"
target="_blank">
</MAP>
<img src="&webhost/recurse.gif"
alt="Recursive SAS Program:
&curprog.sas"
border="0"
usemap="#cr_&curprog"></a>
<font size="2" face="Arial">
<a href="c_&curprog.html"
target="_blank">
<br>&curprog</a>
</font>
</td>
</tr>
</table>
</center></div>
endsubmit;
Since there are so many objects to manage in this diagram, it is worth the effort to systematically generate the code for these image maps. Conclusion A large part of managing a data warehouse is understanding how data is changed during its many transformations. The ability to capture and document the flow of the data transformation and its metadata changes are key insights. e-DOC is a tool used to help in documenting this process with a graphical representation to truly show the flow of the transformations. At Genentech, Inc., clinical trial data is merged and transformed to produce report-ready files which support clinical trial reports used for FDA submissions. Documenting this process is a necessity in keeping with FDA requirements. HTML proves to be versatile yet easy for the generation of this documentation, making it more accessible and easier to navigate in a standard file format. Also the documentation provided through the HTML pages can be converted to PDF to provide supplemental documentation to the electronic final reports. For the Genentech, Inc. Electronic Reporting pilot project, the e-DOC components tracked the transformations of clinical trial data and the production of SAS output during the development stages of the project. At the final report publishing stage, the e-DOC tools, which facilitate the programming and data warehousing activities, were also implemented to help integrate the report components. The advantages are a single process and technology to meet the needs of different users. The result is a process which merges the generation of the clinical data warehouse and the production of the clinical trial report document. ACKNOWLEGEMENTS We wish to thank the "e-team" at Genentech, Inc. including: Dave Christiansen, Amy Kuettner, Guy Pawson, Dave Sundin and Tri Tu for their ideas and contributions to this project. SAS is a registered trademark or trademark of SAS Institute Inc. in the USA and other countries.
® indicates USA registration. Authors: Kathy Boussina |


